Lab 1. Data Wrangling
PUBH 6199: Visualizing Data with R, Summer 2025
2025-05-22
About GitHub
- GitHub is a cloud-based platform for version control and collaboration.
- Storing your code in a “repository” on GitHub allows you to:
- Track changes to your code over time
- Collaborate with others on projects, including your “future self”
- Share your work with the world
- Made possible by the open-source software, Git
About Git
- Git is a version control system that allows you to track changes to files.
- A typical Git-based workflow includes:
- Clone a repository from GitHub to your local machine
- Branch off the main copy of the files that you are working on
- Edit files independently and safely on your own branch
- Let Git keep track of the changes you and others make
- Let Git intelligently merge your changes back into the main copy of the files
How do Git and GitHub work together?
What is a Git repository?
- A collection of files and their history, can be local (on your computer) or remote (on GitHub)
- When you make changes (or commits) to the files, Git keeps track of the changes
Plenty to do in your browser
- Create a Git repository, create branches, upload and edit files
But, most people work locally, then continue to sync local changes with the remote repository on GitHub
- Use Git commands in the terminal or GitHub Desktop
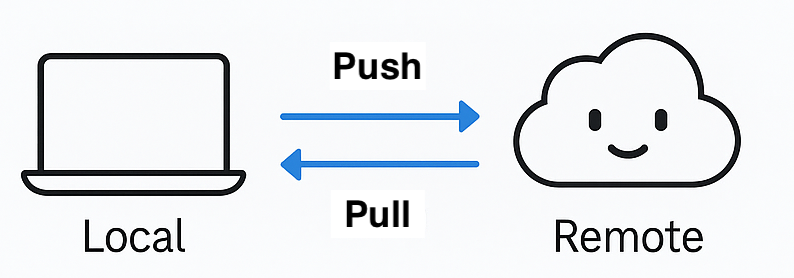
- Pull the latest changes from the remote repository
- Push back your own changes to the same remote repository
![]()
Congratulations!

Introducing GitHub Flow

Image by Yan Min Thwin
Create local branches with Git
Tip
You can do these using the Git GUI in RStudio, I am showing you the command line version so you can learn a different method and choose what you prefer.
- In RStudio click the Terminal tab in the lower left pane, next to the Console tab
Note
If you cannot find the Terminal tab, you can also open a terminal window by clicking on the Tools menu and selecting Terminal > New Terminal. If that doesn’t work, check if your RStudio is out of date. Click Help, About RStudio to check the current version.

“80% of data scientists’ time is spent on data wrangling”
Data wrangling: also known as data cleaning or data preparation, is the process of collecting, cleaning, transforming and organizing data from one “raw” form into another format with the intent of making it more appropriate for analysis.

Source: R for Data Science
Lots of verbs to remember!

Refer to this cheat sheet
Introduction to tidy data
“Happy families are all alike; every unhappy family is unhappy in its own way.”
- Leo Tolstoy, Anna Karenina
“Tidy datasets are all alike, but every messy dataset is messy in its own way.”
- Hadley Wickham, Tidy Data

What is tidy data?

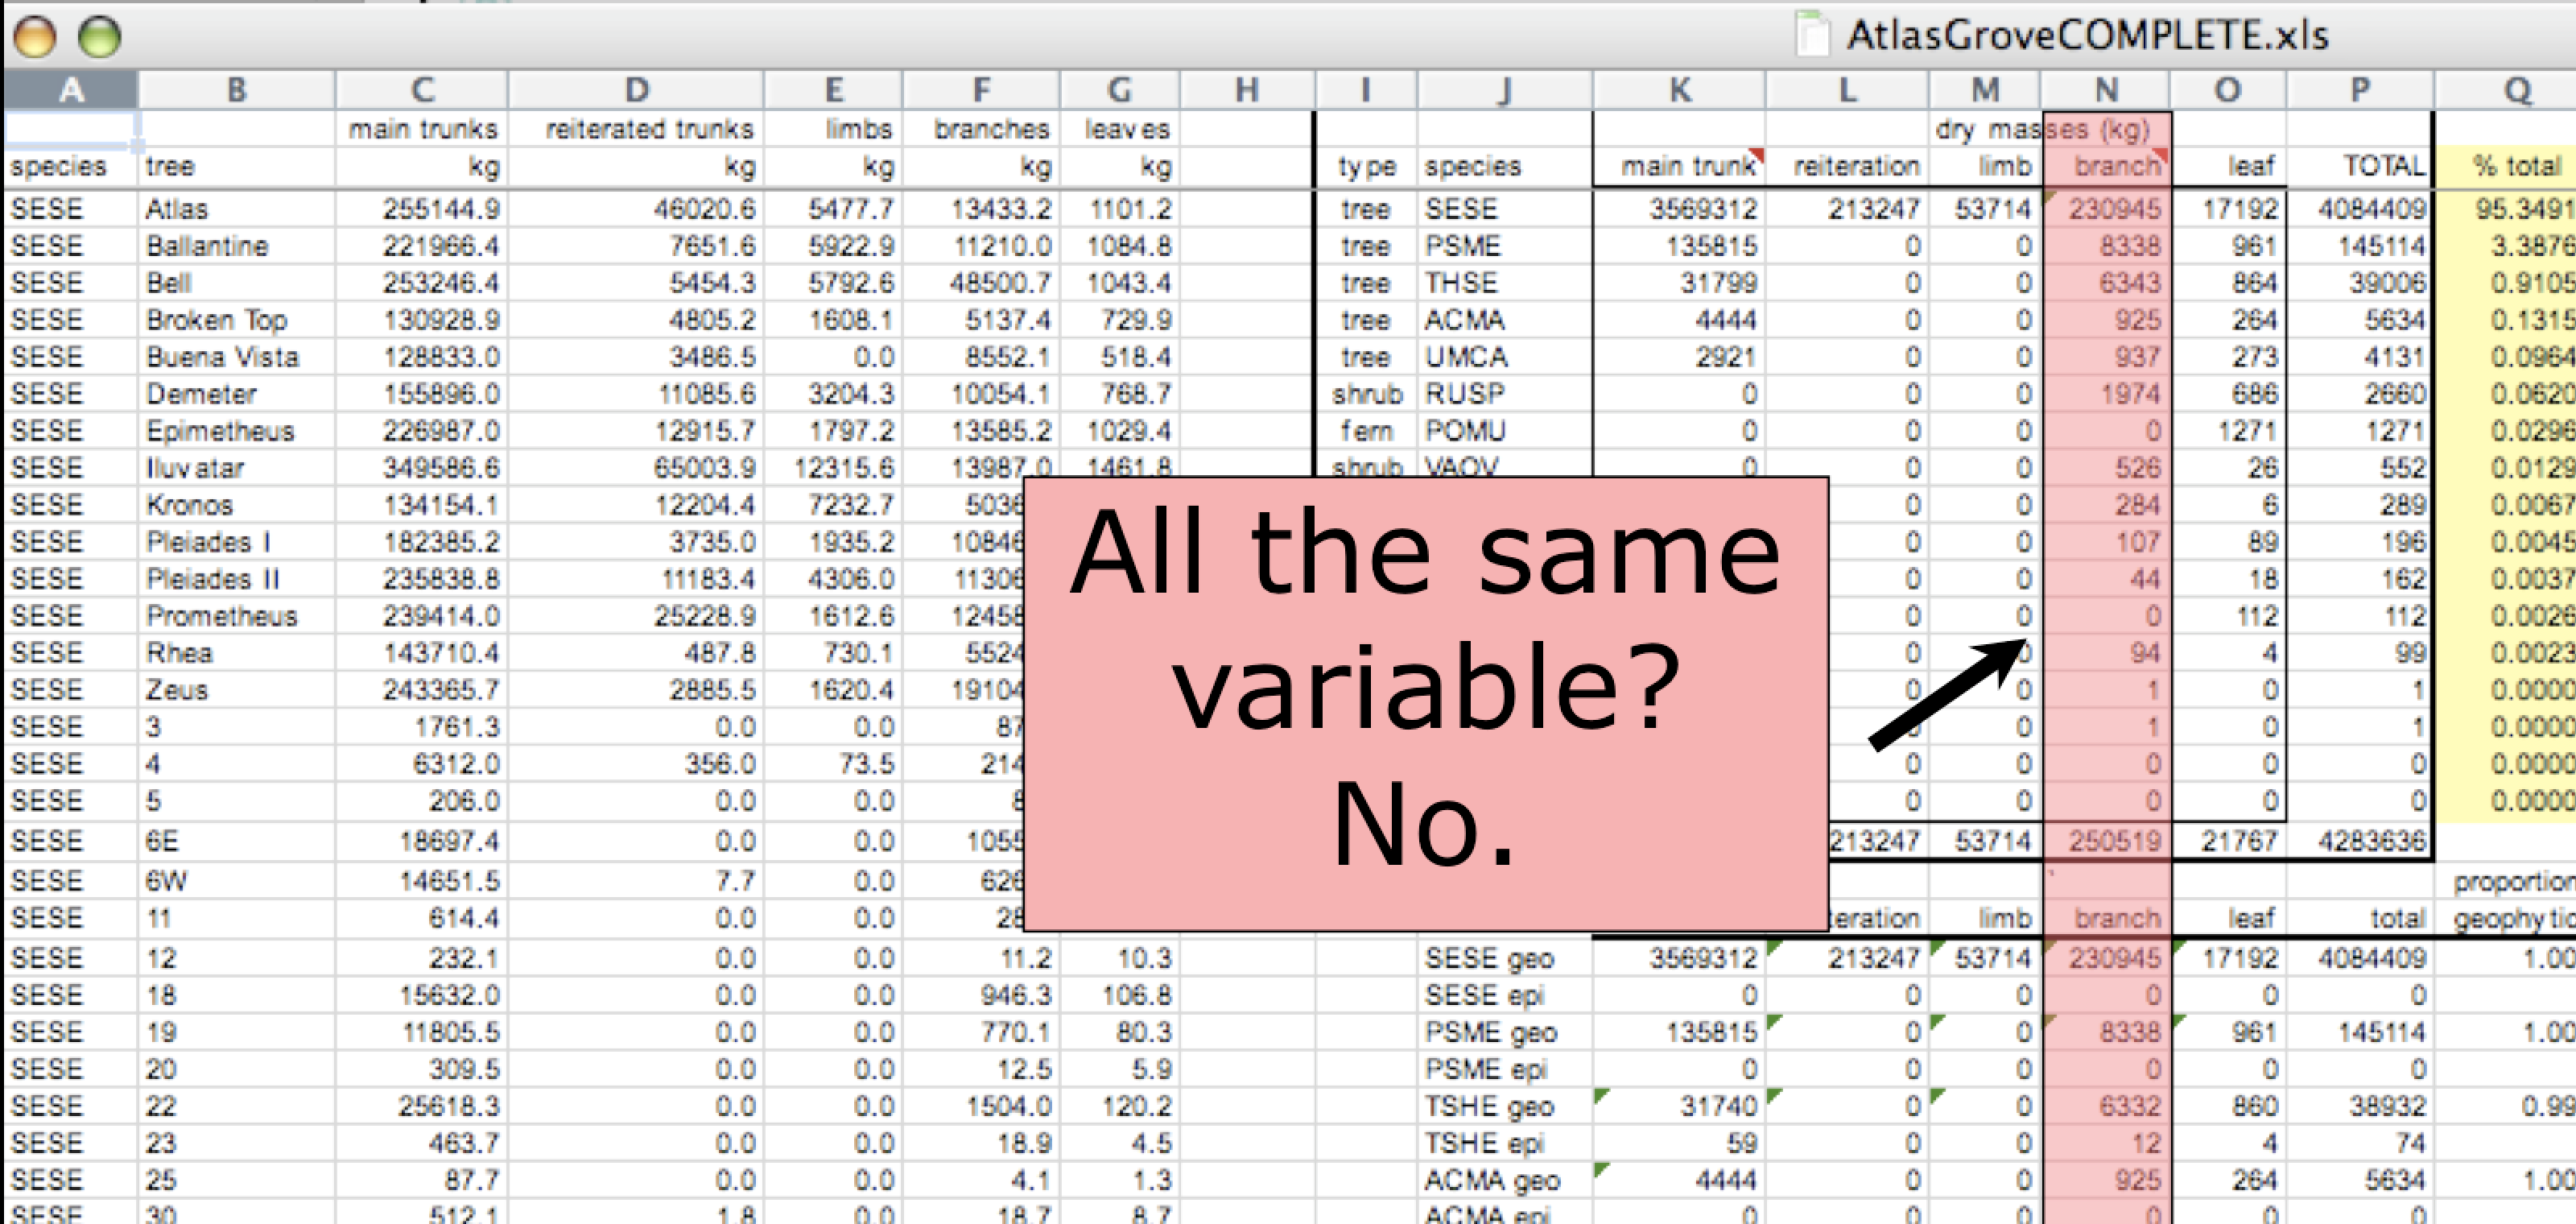
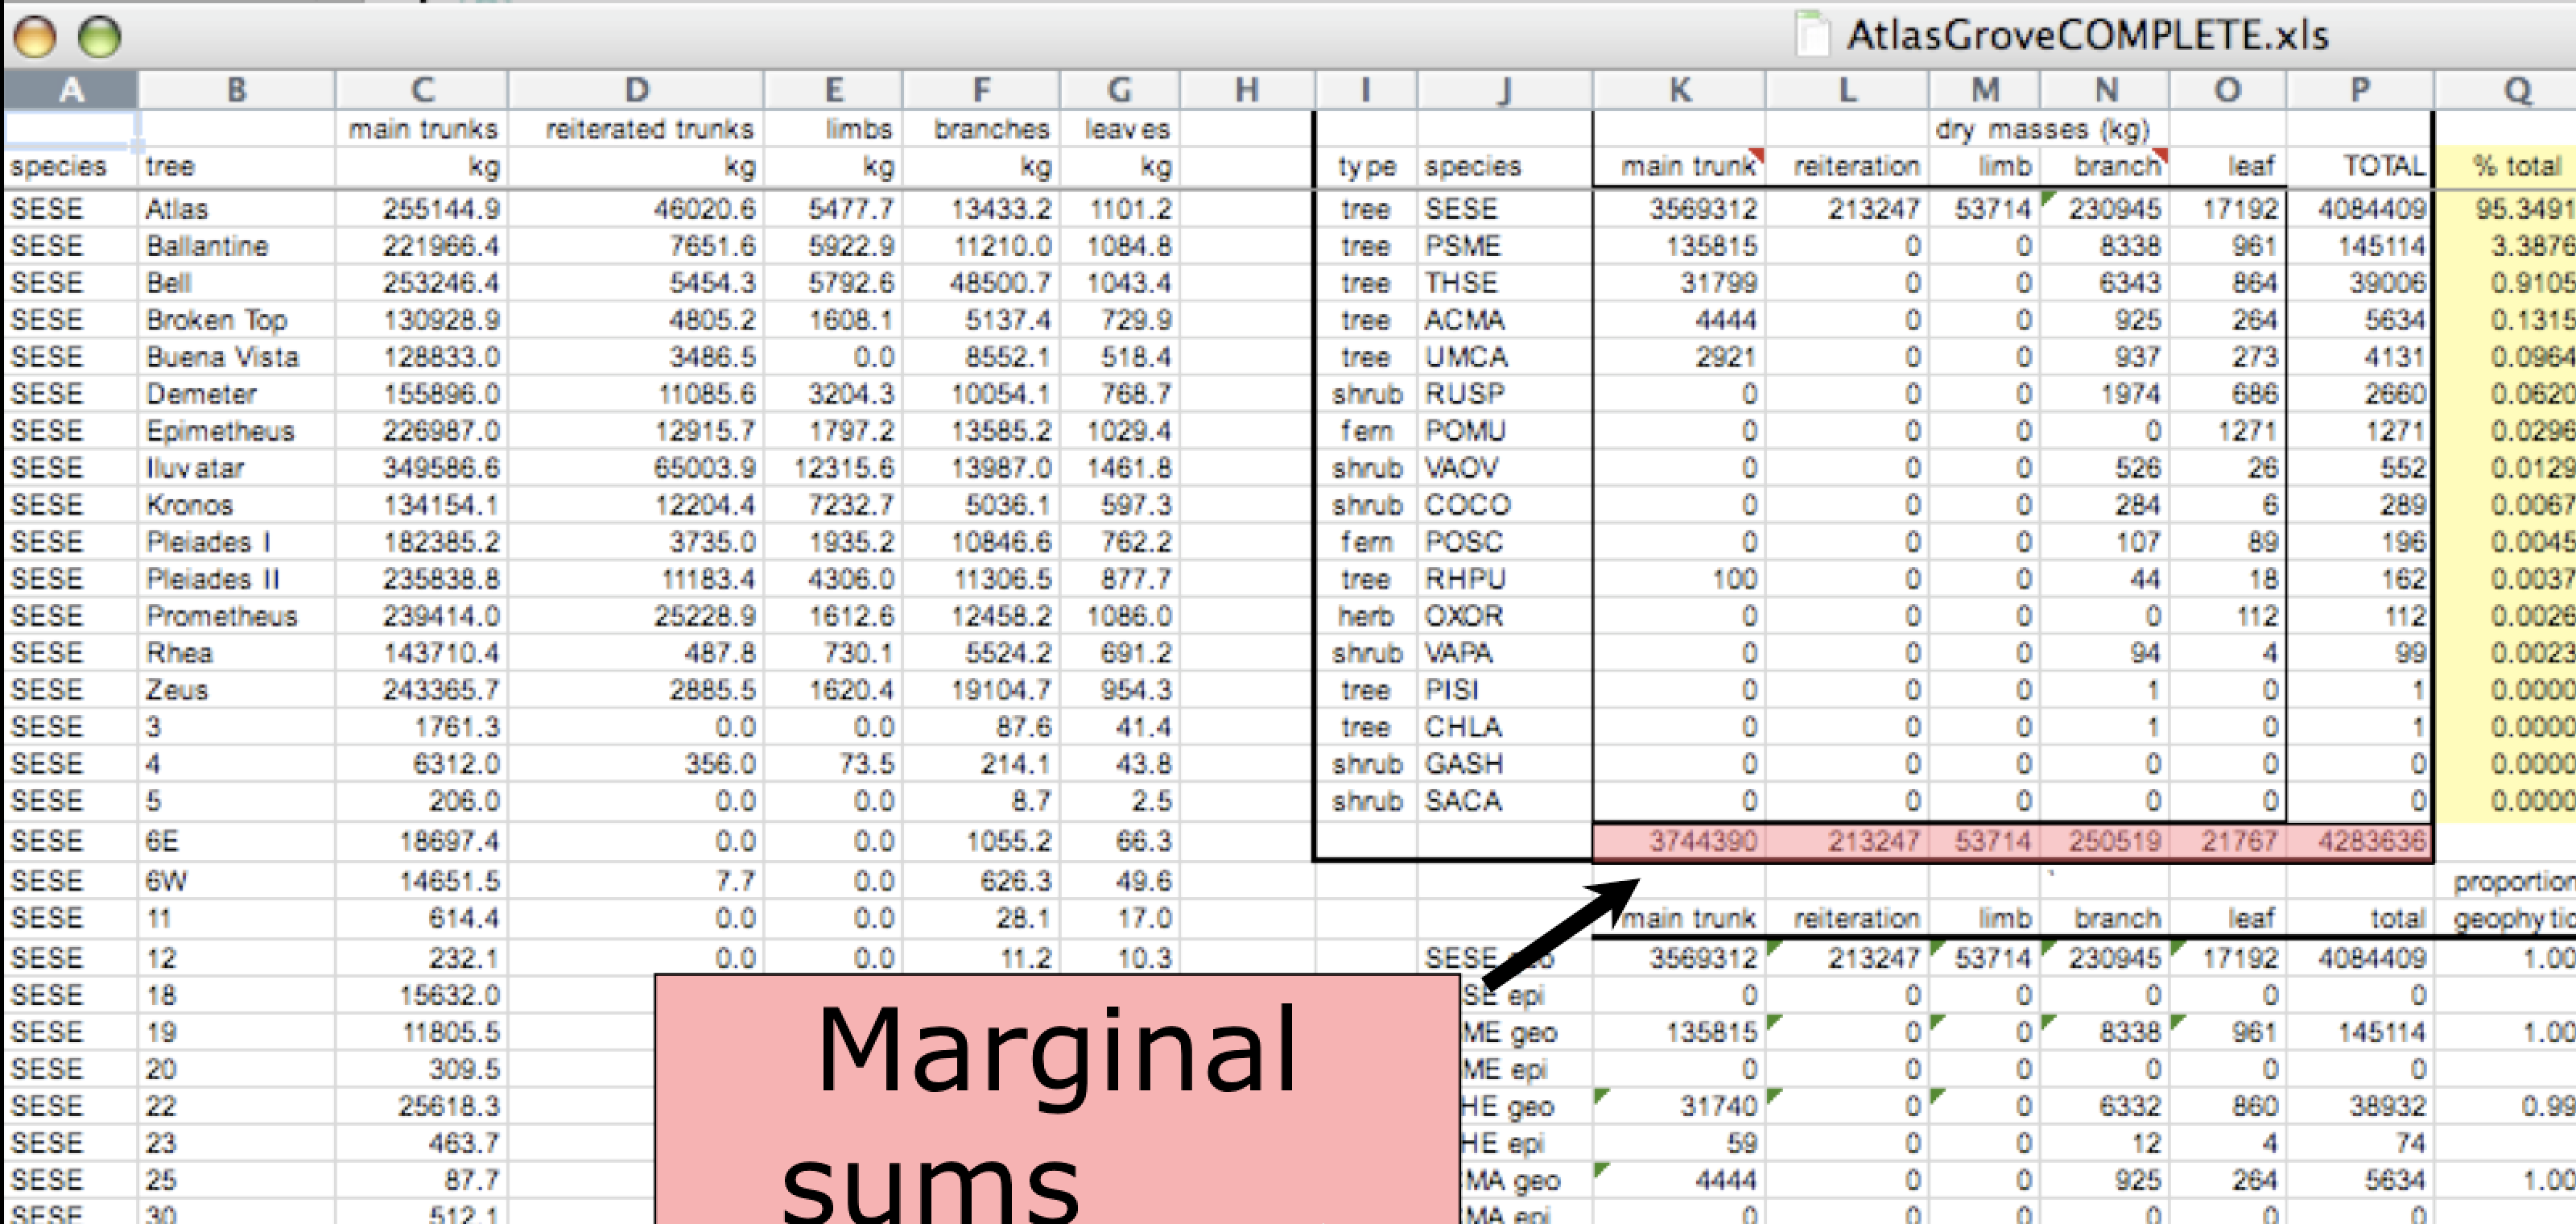
What is an example of untidy data?

Multiple tables, not machine-readable
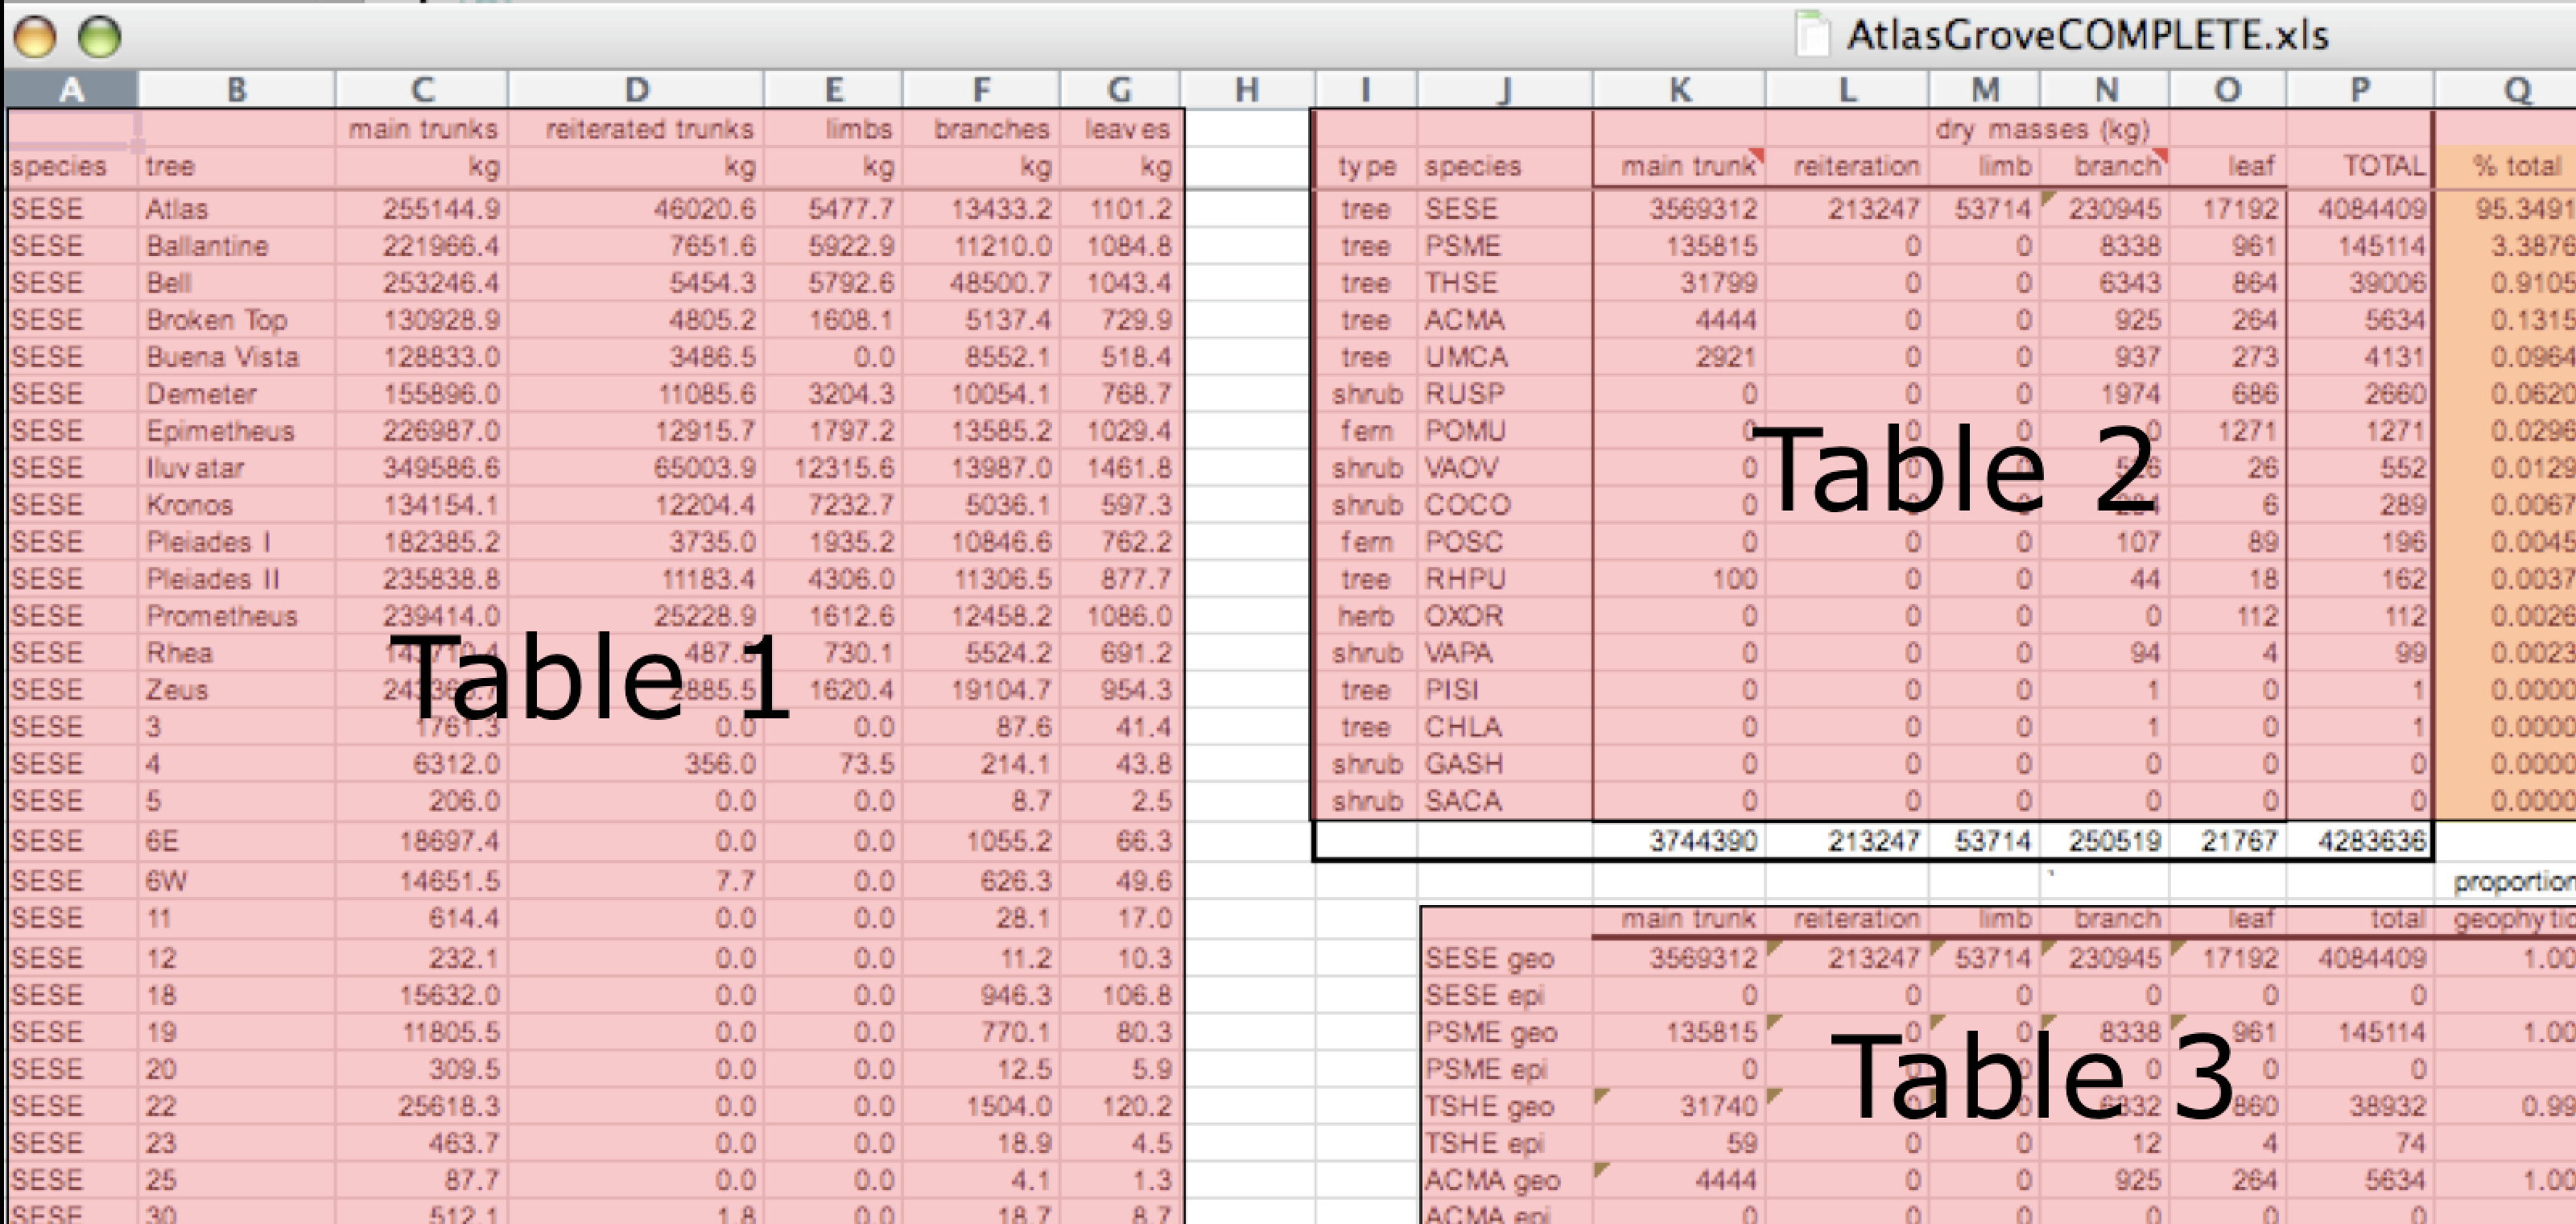
Inconsistent columns
Inconsistent rows
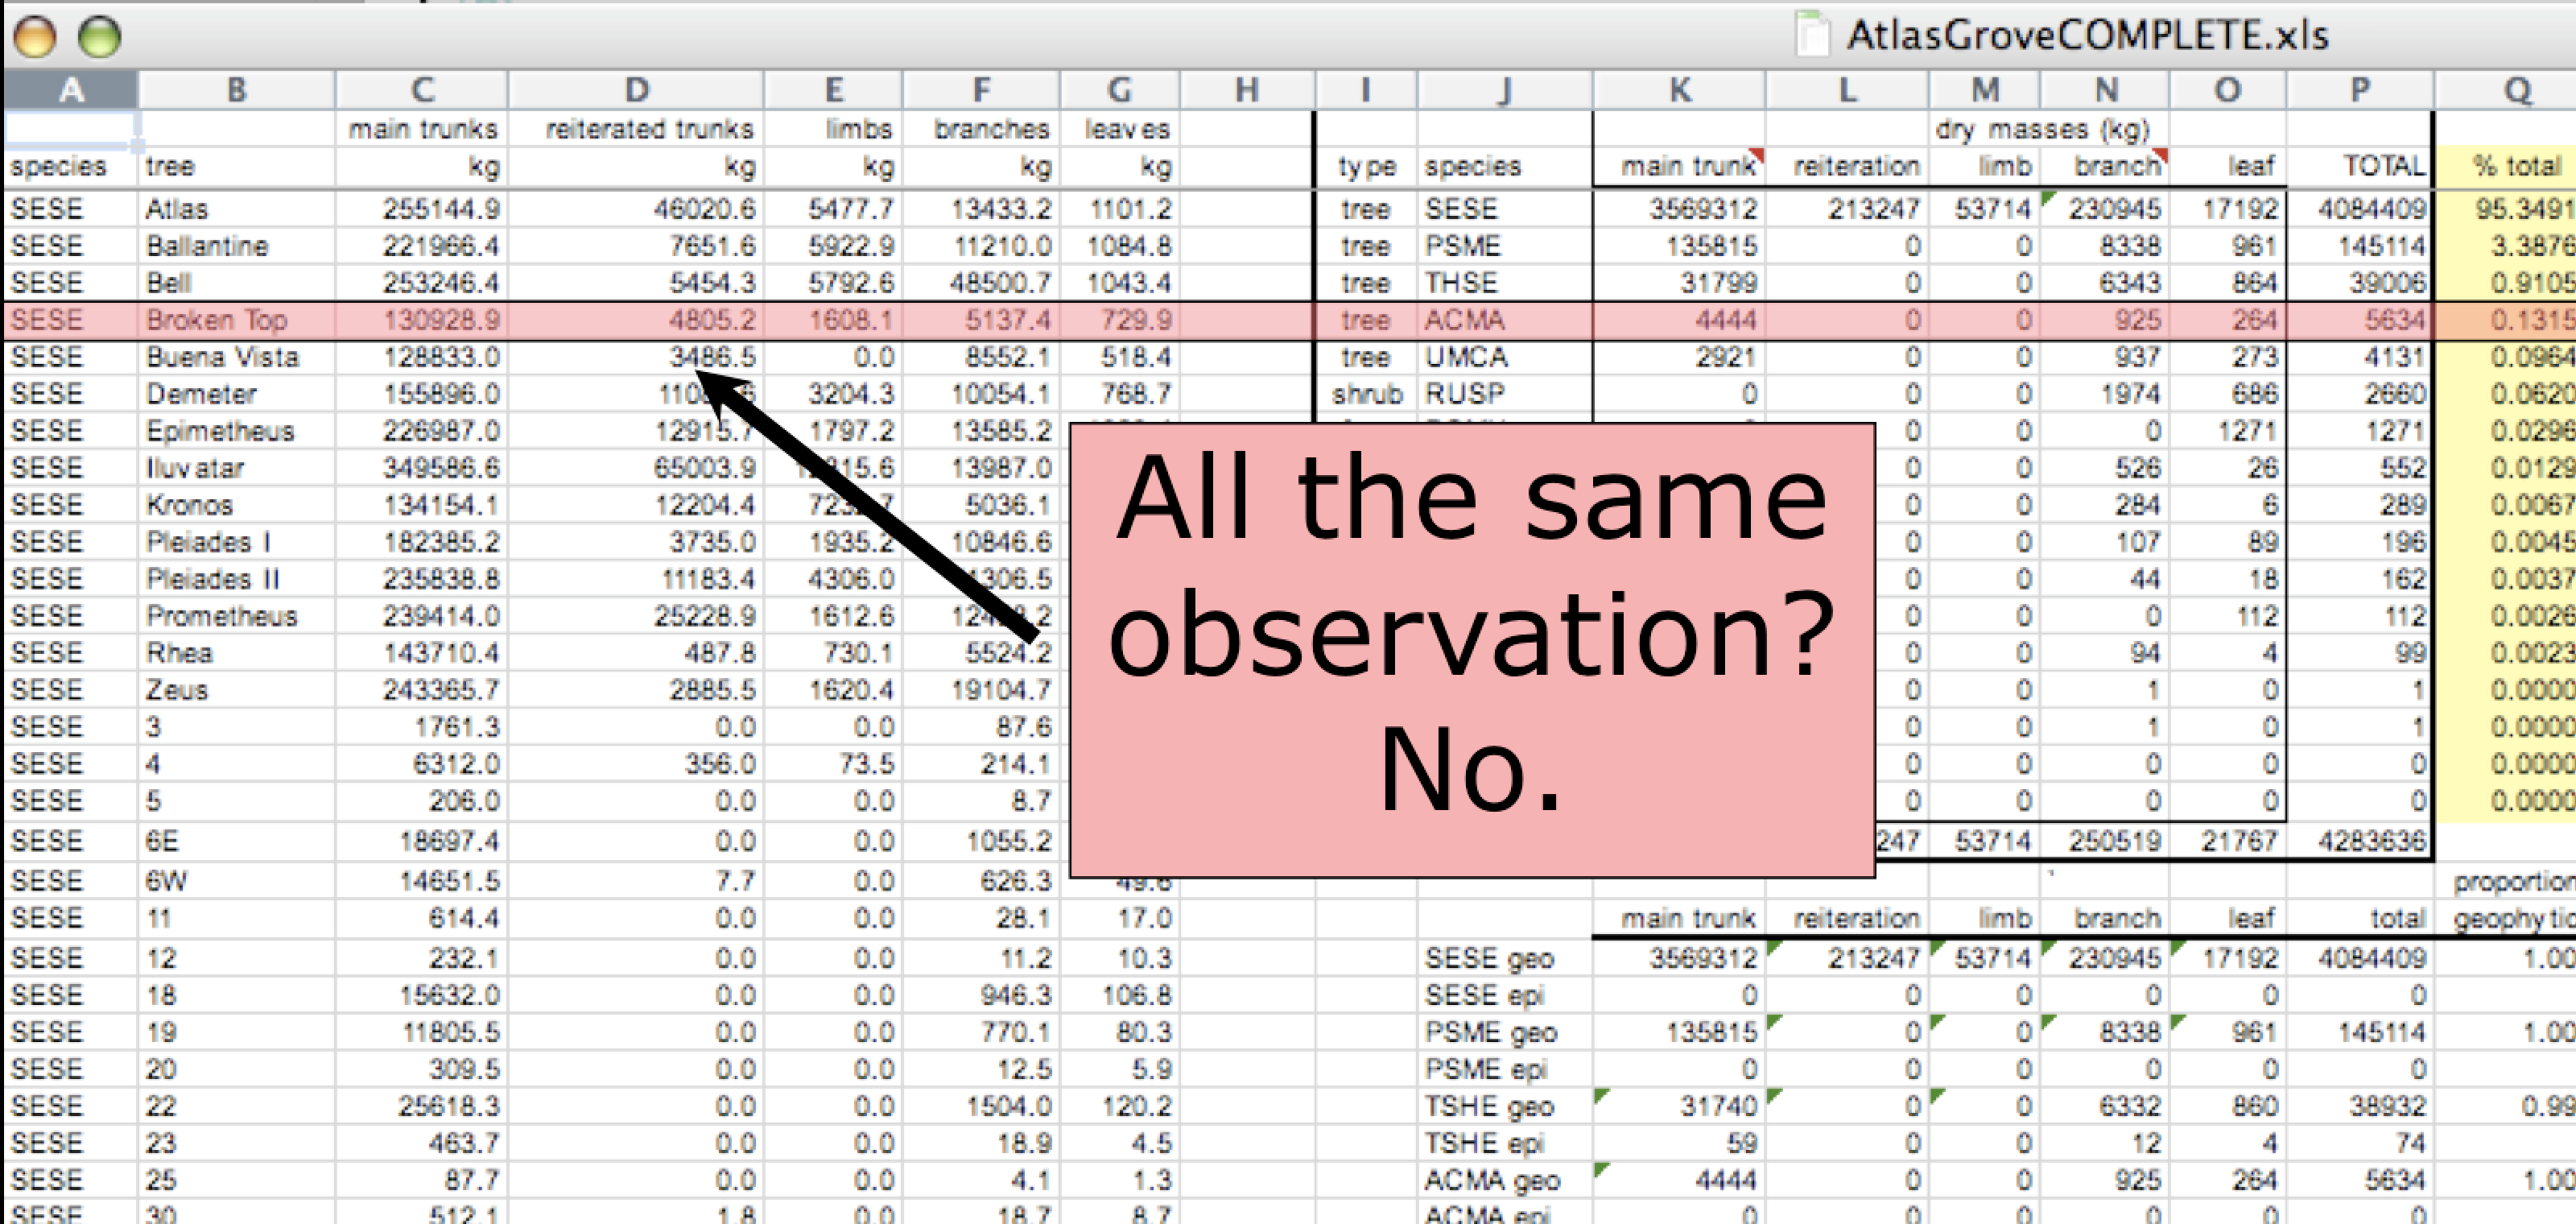
Marginal sums and statistics
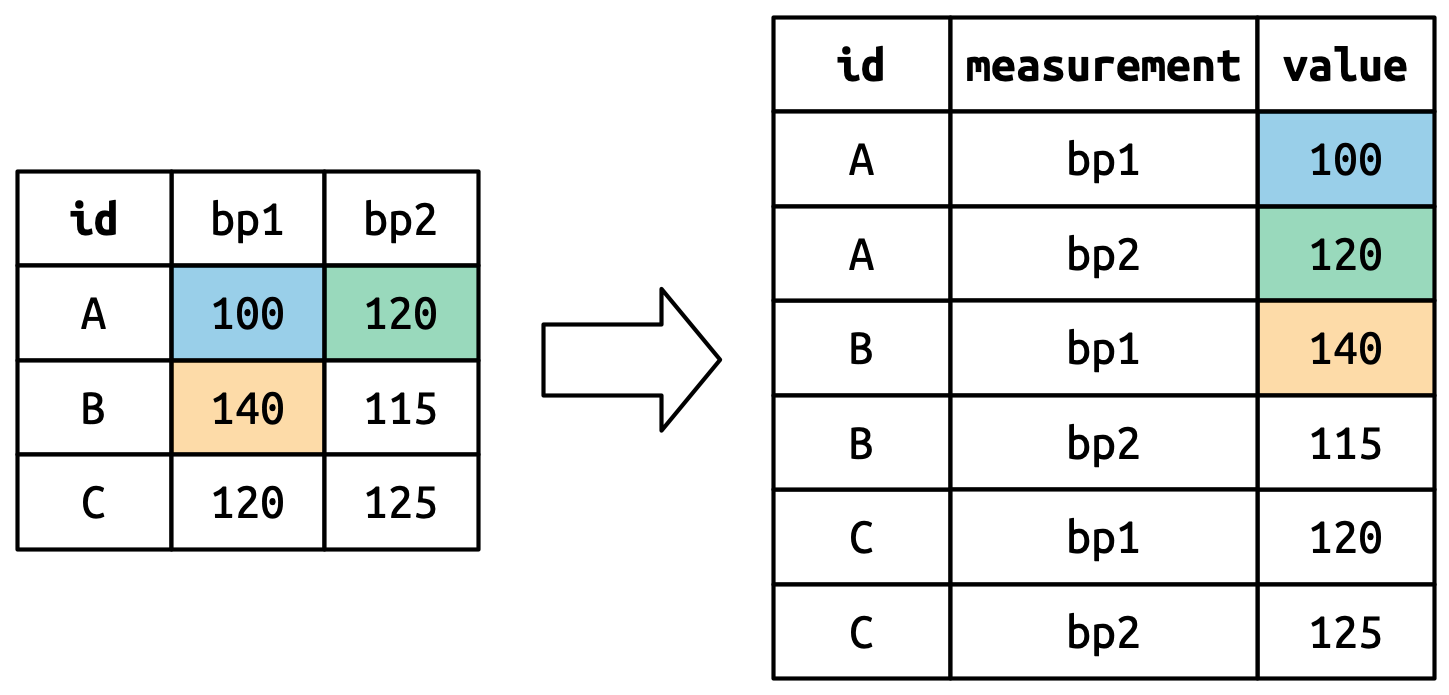
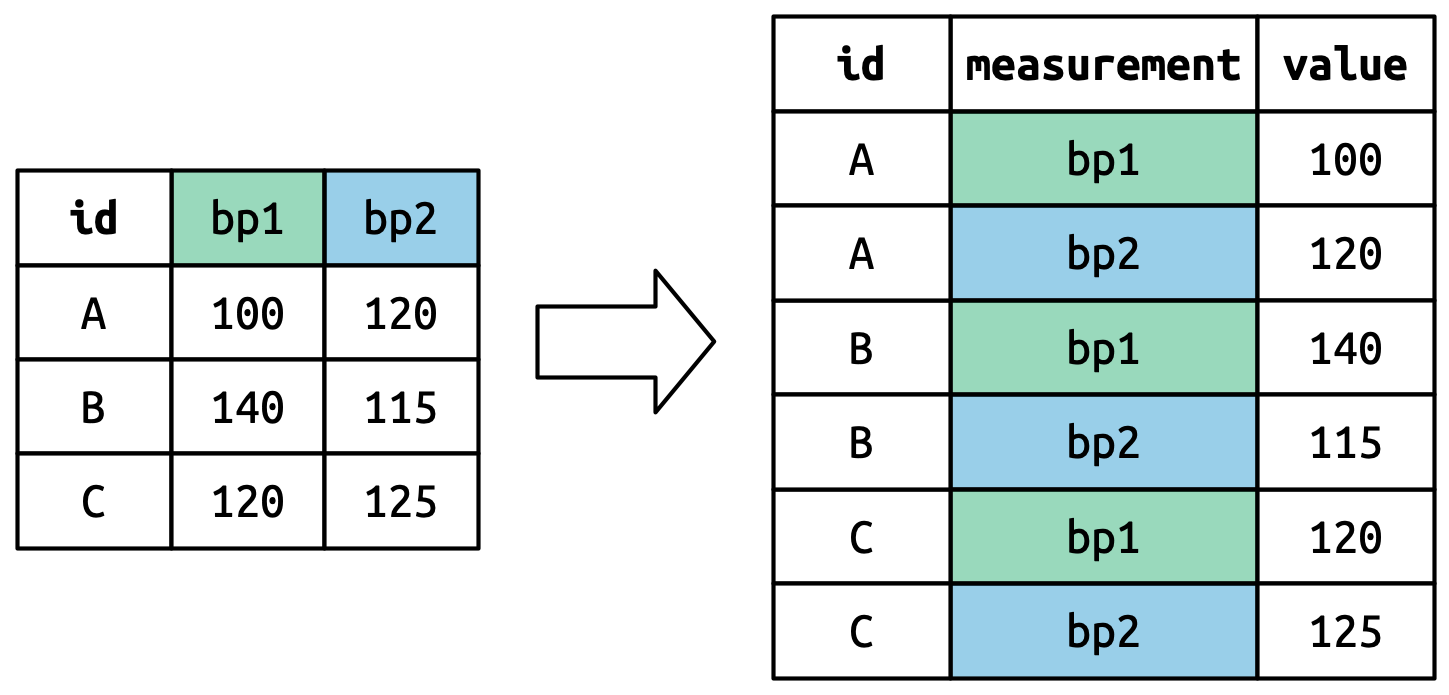
How does pivot_longer() work?
Repeat id twice
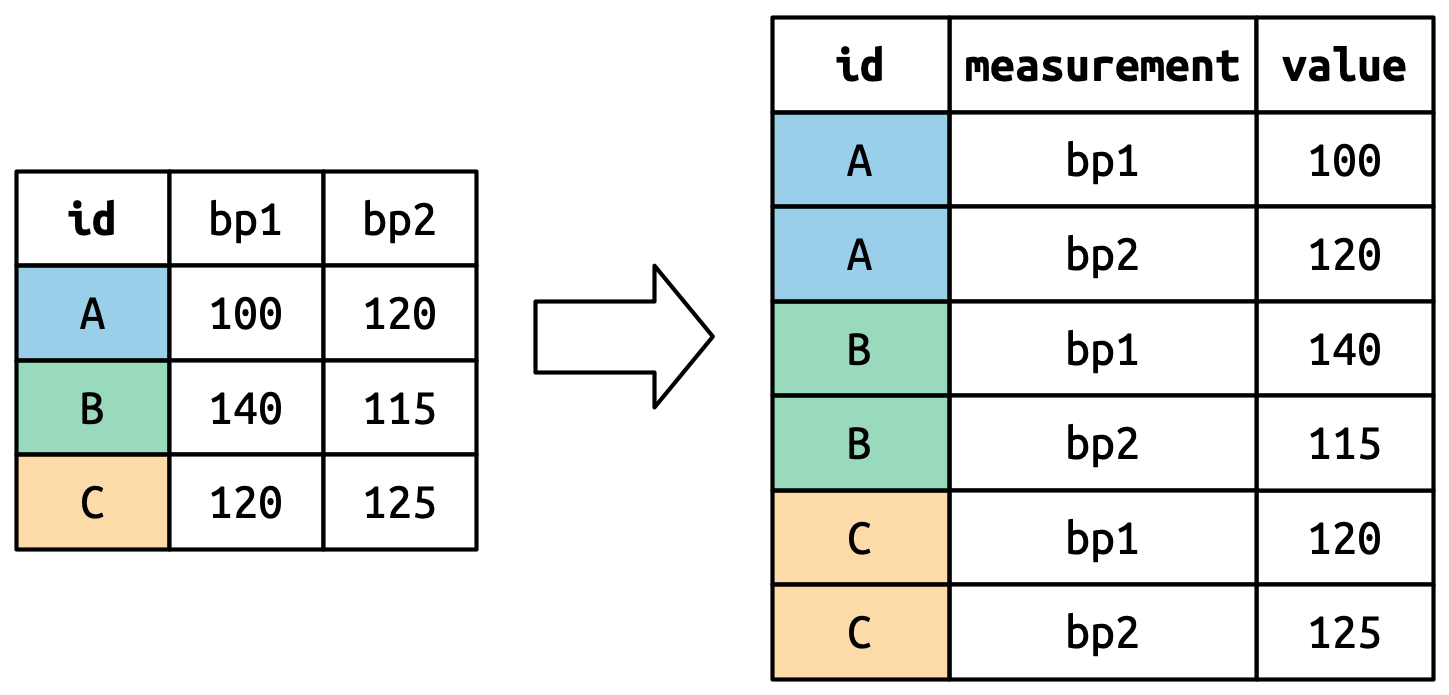
bp1 and bp2 become values in a new column
The number of values is preserved and unwound row-by-row.